Headlines usually summarize the stock market with a single number: the S&P 500 rose or fell. But an index is an average, and averages can hide a lot. Market breadth is the study of how many stocks are actually participating in a move, and it often tells a more complete story than the index level alone.
Why the index can mislead
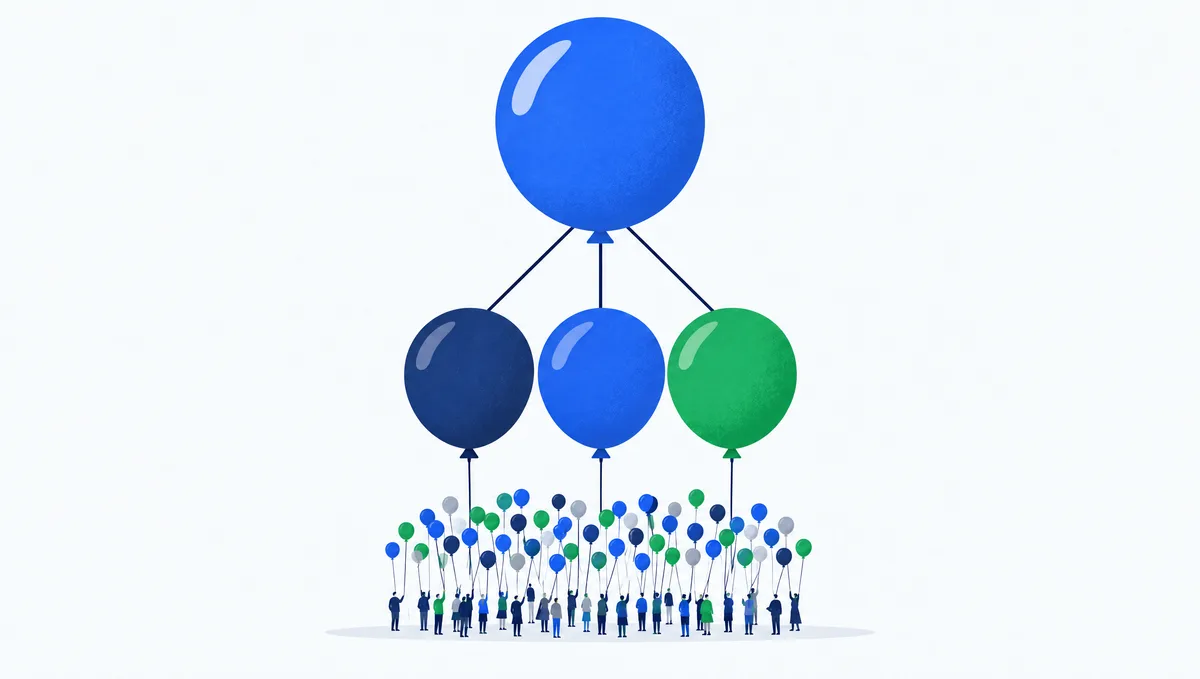
The S&P 500 is a capitalization-weighted index. Each company’s influence is proportional to its total market value. The largest companies, which in recent years have been mostly giant technology and communication firms, carry far more weight than the smallest members. A strong day for a few of those giants can lift the index even if most stocks in it fall.
This concentration has become a defining feature of the modern market. In recent years the ten largest companies have at times made up roughly a third of the index’s total value, a level of concentration rarely seen in its history. When those companies do well, the index looks healthy; when they stumble, the index can fall even while many other stocks hold up.
Common breadth indicators
Advancers vs. decliners
The simplest measure counts how many stocks rose and fell on a given day. The advance-decline line adds up the daily difference over time. If the index is making new highs but the advance-decline line is falling, fewer stocks are carrying the rally, a pattern analysts call negative divergence.
Stocks above their moving averages
Another popular gauge is the percentage of index members trading above their 200-day moving average, a common marker of a longer-term uptrend. A high reading means most stocks are in uptrends; a low reading means weakness is widespread even if the index looks fine.
New highs vs. new lows
Counting how many stocks are hitting 52-week highs versus 52-week lows shows whether leadership is broadening or narrowing.
Equal weight vs. cap weight
An easy way to check breadth is to compare the regular S&P 500 with its equal-weight version, in which every company gets the same weight regardless of size. The equal-weight index is tracked by funds you can look up on any market data site. When the cap-weighted index outperforms the equal-weight version by a wide margin, gains are concentrated in the largest stocks. When the equal-weight index keeps pace or leads, the rally is broad.
Why breadth matters for investors
Breadth is not a timing tool. Narrow markets can persist for long periods, and the largest companies often lead because their earnings are genuinely growing faster. But breadth adds context in a few ways:
- It shows how dependent your index fund’s returns are on a small group of companies.
- It helps explain why an individual stock portfolio may lag the index during a narrow rally.
- Broadening participation after a decline is often seen as a sign of a healthier recovery.
When you next read that the market hit a record, look one layer down. How many stocks joined in tells you whether the whole market or just its biggest names are doing the work. For the forces behind the biggest names, see our guide to Big Tech’s AI spending.