When a company like Microsoft, Alphabet, Amazon, Meta, or Apple reports quarterly results, the headline usually says whether earnings “beat” or “missed” expectations. That tells you very little. These companies are collections of very different businesses, and the market’s reaction depends on details buried deeper in the release.
Step 1: find the documents
Each company posts an earnings press release and usually a slide presentation on its investor relations website, and files the release with the SEC on Form 8-K. The full quarterly report, Form 10-Q, follows. Most companies also hold a conference call with analysts shortly after the release; a replay or transcript is typically available on the investor relations site.
Step 2: go straight to the segments
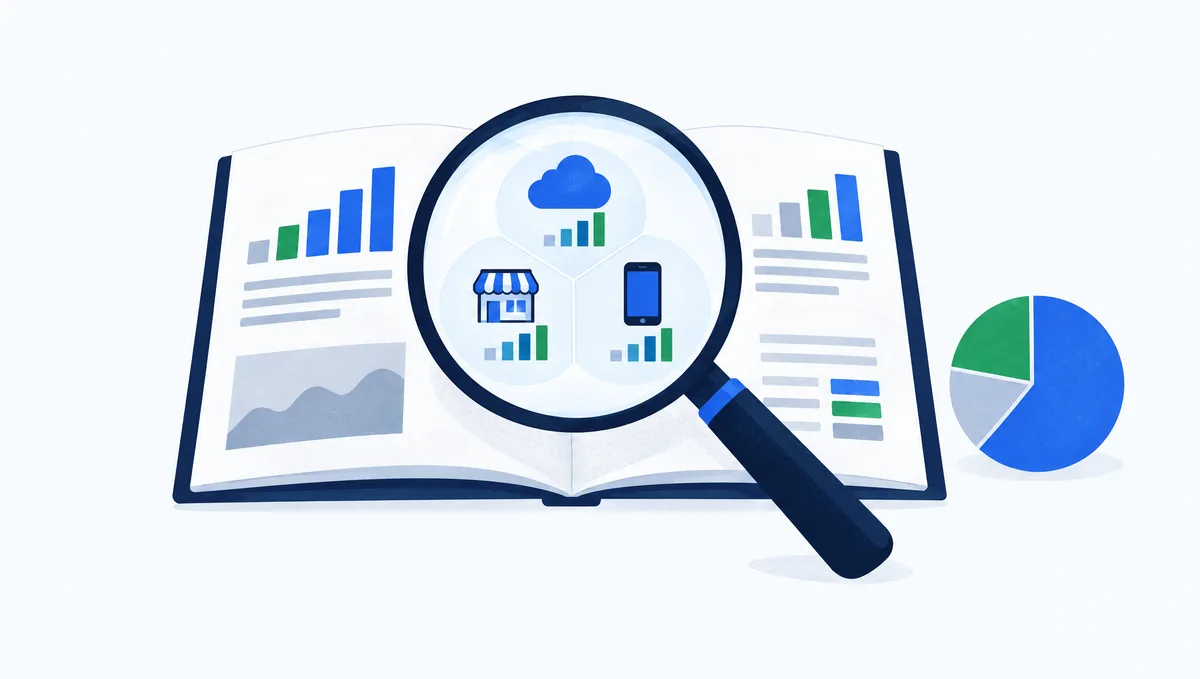
Consolidated revenue can hide diverging trends. Look at the segment table. Examples of segments the market focuses on include:
- Cloud: Amazon Web Services, Microsoft’s Intelligent Cloud segment and its Azure growth rate, and Google Cloud.
- Advertising: Alphabet’s Search and YouTube ads, Meta’s Family of Apps.
- Devices and services: Apple reports revenue by product category and for Services, which carries higher margins than hardware.
Compare each segment’s growth rate with the prior quarter and with the same quarter last year. Acceleration or deceleration in a key segment often matters more than the total.
Step 3: check margins and operating income
Revenue growth is only half the story. Operating margin shows how much of each dollar becomes profit. Look at operating income by segment where it is disclosed. Rising costs from AI infrastructure, depreciation of new data centers, or headcount changes all show up here.
Step 4: capex and free cash flow
For the largest tech companies, capital expenditures have become one of the most scrutinized numbers. Heavy AI investment shows up in the cash flow statement as purchases of property and equipment. Investors want to know whether spending is rising, what management expects for the rest of the year, and whether revenue from AI products is growing fast enough to justify it. Free cash flow, operating cash flow minus capex, shows what is left for buybacks, dividends, and acquisitions.
Step 5: GAAP vs. non-GAAP
Many tech companies report “adjusted” or non-GAAP earnings that exclude items like stock-based compensation or acquisition-related costs. Companies must reconcile these figures to GAAP numbers in the release. Check the size of the adjustments. Stock-based compensation is a real cost to shareholders because it dilutes ownership, even though it does not use cash.
Step 6: guidance and the call
The stock often reacts most to what management says about the future: revenue and margin guidance, capex plans, demand commentary, and answers to analysts’ questions. A company can beat estimates for the quarter and still fall if its outlook disappoints. We cover this in detail in why a stock can fall after beating earnings.
A quick checklist
- Key segment growth vs. last quarter and last year
- Operating margin trend
- Capex and free cash flow
- Size of non-GAAP adjustments
- Guidance vs. consensus
- Tone and specifics on the conference call