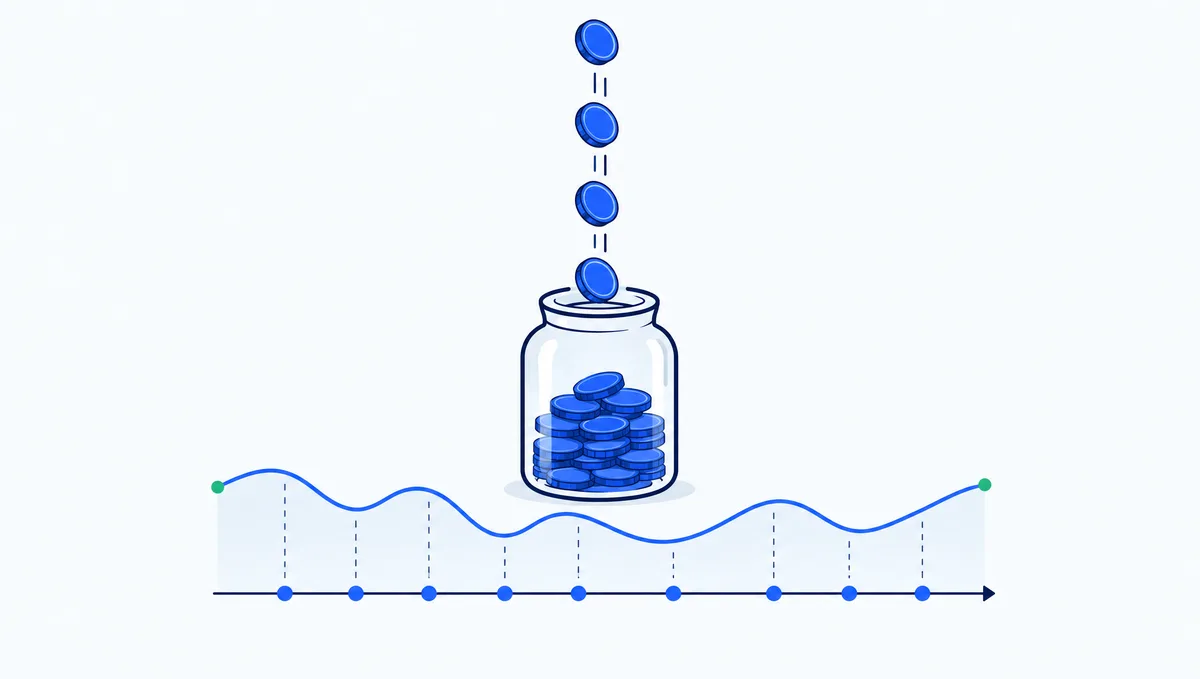
Profit is an accounting number. Cash is what a company can actually spend. That difference is why many investors, especially in technology, pay close attention to free cash flow. It shows how much money a business generates after paying for everything it needs to keep operating and growing.
The formula
Free cash flow (FCF) is usually calculated from the cash flow statement:
Free cash flow = cash flow from operations − capital expenditures
Cash flow from operations starts with net income and adjusts for non-cash items (like depreciation) and changes in working capital (like money tied up in unpaid customer invoices). Capital expenditures, often called capex, are what the company spends on long-lived assets such as buildings, servers, and equipment.
A simple example
| Line item | Company A | Company B |
|---|---|---|
| Net income | $10.0B | $10.0B |
| Cash flow from operations | $14.0B | $14.0B |
| Capital expenditures | $3.0B | $12.0B |
| Free cash flow | $11.0B | $2.0B |
Both companies report the same profit. But Company A has $11 billion of spare cash each year, while Company B is reinvesting almost everything. Neither is automatically better: Company B’s spending might build a much bigger business later. FCF simply shows where the money is going.
Why investors like free cash flow
- It pays for shareholder returns. Buybacks and dividends come from cash, not accounting profit.
- It is harder to shape. Net income depends on estimates such as depreciation schedules. Cash moving in and out of the bank is more concrete.
- It shows flexibility. Companies with strong FCF can invest through downturns, make acquisitions, or pay down debt without raising new money.
Free cash flow yield
To compare FCF with a stock’s price, investors use free cash flow yield: annual free cash flow divided by market capitalization. A company worth $200 billion that generates $10 billion of FCF has a 5% FCF yield. It works like an earnings yield (the inverse of the P/E ratio) but uses cash instead of profit. Comparing it with the 10-year Treasury yield is one quick way to judge whether a stock looks expensive.
The AI spending era changes the picture
The largest cloud and internet companies are spending unprecedented sums on data centers and AI chips. That capex is subtracted directly from free cash flow, so a company can post record earnings while its FCF flattens or falls. Investors are asking whether that spending will generate enough future revenue to justify it. Our explainer on hyperscaler capex and AI spending covers what to watch in those reports, and how to read a big tech earnings report shows where to find the numbers.
Common traps
- Stock-based compensation: many tech companies pay employees partly in shares. That cost does not reduce cash flow, so FCF can look better than the true economic cost. Some investors subtract it.
- Working capital swings: collecting customer payments early or delaying supplier payments can boost one quarter’s cash flow temporarily.
- Leases and acquisitions: some spending shows up outside the capex line, so check the full cash flow statement.
- One quarter is noise: look at trailing twelve months or several years.
What this means for you
If you own tech stocks, free cash flow tells you whether today’s profits are turning into spendable cash. When a company reports, check:
- Operating cash flow and capex on the cash flow statement, not just earnings per share.
- Whether FCF is rising or falling over the past four quarters combined.
- How much stock-based compensation is flattering the number.
- The FCF yield compared with the 10-year Treasury yield.
- What management says capex will be next year, since that drives future FCF.
The bottom line
Free cash flow is the cash left after a company funds its operations and investments. It is harder to dress up than earnings and it pays for everything shareholders care about, which is why it gets extra attention when capex surges. This article is for education only and is not investment advice.