Some days the S&P 500 barely moves while individual sectors swing sharply in opposite directions. Technology falls, utilities rise, and the index ends flat. That is sector rotation: investors shifting money from one part of the market to another as their view of the economy, interest rates, or earnings changes.
The 11 sectors
US stocks are grouped using the Global Industry Classification Standard (GICS). Each sector has a widely followed exchange-traded fund, which makes rotation easy to track.
| Sector | Common tracking ETF | Type |
|---|---|---|
| Information Technology | XLK | Cyclical / growth |
| Communication Services | XLC | Cyclical / growth |
| Consumer Discretionary | XLY | Cyclical |
| Financials | XLF | Cyclical |
| Industrials | XLI | Cyclical |
| Materials | XLB | Cyclical |
| Energy | XLE | Cyclical / commodity |
| Real Estate | XLRE | Rate-sensitive |
| Health Care | XLV | Defensive |
| Consumer Staples | XLP | Defensive |
| Utilities | XLU | Defensive / rate-sensitive |
Cyclical versus defensive
Cyclical sectors sell things people and businesses buy more of when times are good: cars, travel, factory equipment, raw materials, loans. Their profits swing with the economy. Defensive sectors sell things people keep buying in any economy: groceries, medicine, electricity. Their profits are steadier, so they tend to hold up better in slowdowns but often lag in strong markets.
The textbook rotation cycle
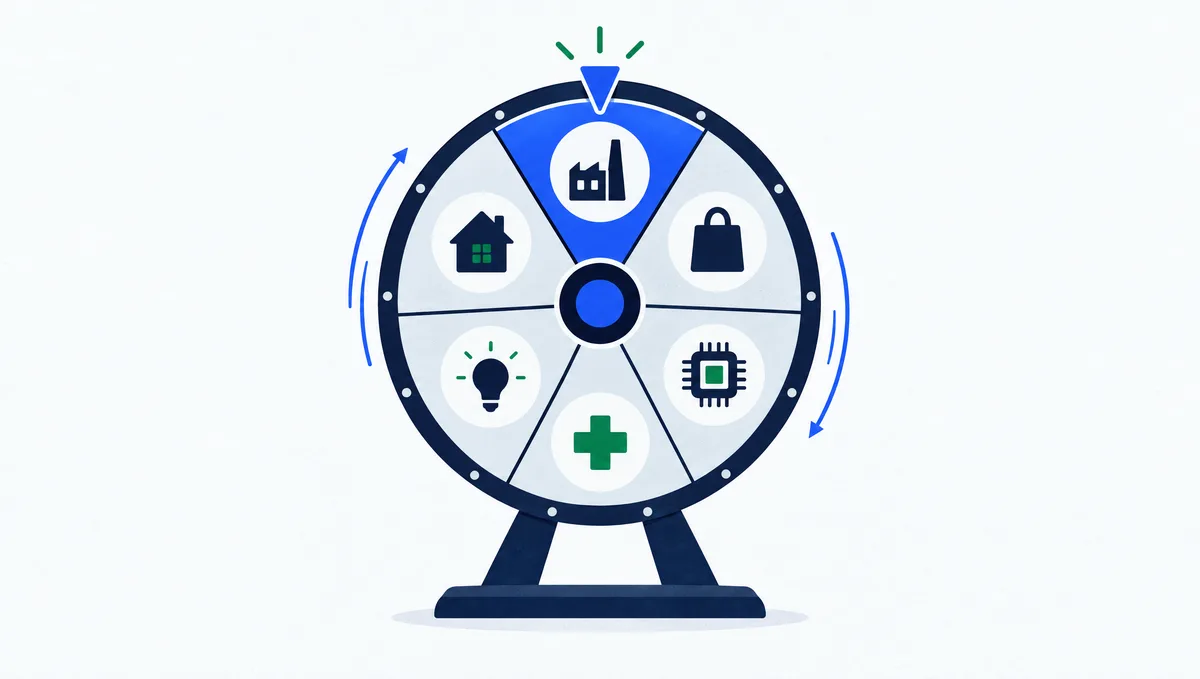
A classic model links sector leadership to the stages of the business cycle:
- Early recovery: financials, consumer discretionary, and industrials often lead as rates are low and growth rebounds.
- Mid-cycle: technology and industrials benefit from steady growth and business investment.
- Late cycle: energy and materials can lead as demand and prices peak and inflation rises.
- Slowdown or recession: health care, consumer staples, and utilities tend to hold up best.
Real markets rarely follow the script cleanly. Interest rates, commodity prices, and big themes such as AI spending can override the cycle for years.
Interest rates drive a lot of rotation
Rate expectations are one of the biggest forces behind day-to-day rotation. When yields rise, long-duration growth stocks and rate-sensitive sectors such as real estate and utilities often lag, while financials can benefit. When yields fall, the pattern often flips. Our guide to why the 10-year Treasury yield matters explains the link.
How to spot rotation
- Compare sector performance over one week, one month, and three months. Leadership that persists across timeframes is more meaningful than one day’s move.
- Use a heatmap. Our homepage heatmap groups the market by sector so you can see where money is flowing at a glance.
- Check breadth. If the index is rising but only one sector is carrying it, that is narrow leadership. See market breadth explained.
- Watch equal-weight versus cap-weight. When the equal-weight S&P 500 beats the regular index, gains are spreading beyond the largest companies.
What this means for you
Rotation explains why your portfolio can move differently from the index. A quick monthly check:
- List how much of your portfolio sits in each sector; many investors are more concentrated in tech than they realize.
- Compare the last three months of sector performance with your holdings.
- Note whether rates are rising or falling, since that drives much of the rotation.
- Avoid chasing last month’s leader; rotation can reverse quickly.
- If you use broad index funds, remember you already own every sector.
The bottom line
Sector rotation is the market repricing different parts of the economy as conditions change. Understanding cyclical and defensive sectors and the role of interest rates helps explain market moves, even if the cycle is too messy to trade reliably. This article is for education only and is not investment advice.